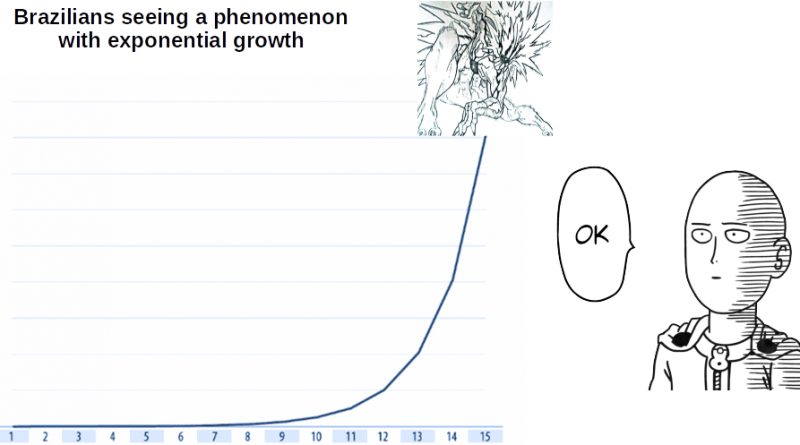
Who’s afraid of the bad chart?
Have you heard the term “exponential”? Perhaps in a context more or less like this: “Such a thing has an exponential growth!”.
When this term appears associated with losses of any kind, it is somewhat alarming, although for many people it may not seem so.
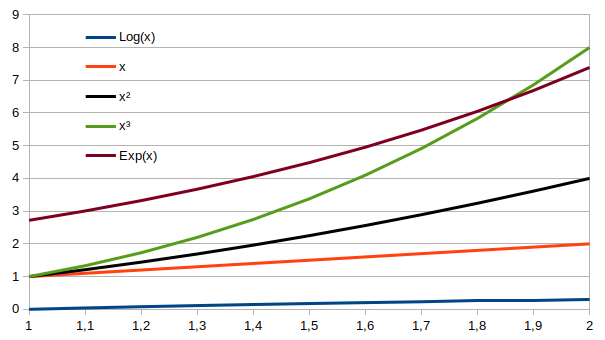
The meme on the cover of this post is related to episode 12 of the anime One Punch Man, in which Lord Boros facing Saitama, realizes that he will not be able to measure efforts to defeat him, and then begins to increase his power. But that doesn’t happen in a logarithmic, linear, quadratic, cubic way … but, exponentially. Let’s take a look at what that means. We have a “threat” that is increasing its power. The graph below shows the increase in logarithm, linear, quadratic, cubic and exponential functions in different colors. Notice that the blue logarithmic curve down there started at 0 and barely moved. The linear curve x in red is very low too, the black curve x² is a little low, but the green curve x³ is the one that grew the most in this interval. More than the exponential curve of x, represented by Exp (x). Does this mean that the cubic curve is more terrible than the exponential?
We will continue this analysis by discarding the logarithmic, linear and quadratic curves, and adding an x⁴ and x⁵ curve to see what happens. We are also going to increase this range now from 1 to 10.
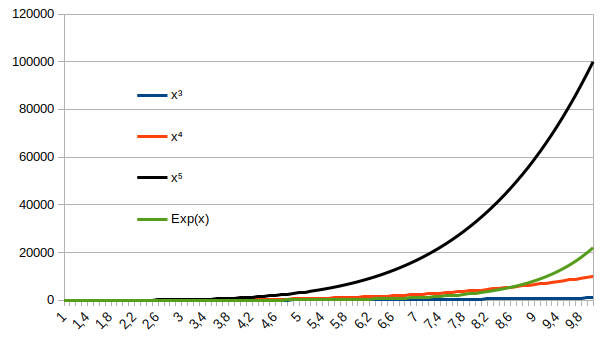
As you can see, curve x³ could be above Exp (x) in the previous interval, and also curve x⁴ was above Exp (x) up to point 8.6. But after that Exp (x) became worth more than both, but much less than x⁵. Does this mean that the x⁵ curve is more terrible than the exponential?
We will continue this analysis by discarding the x³ and x⁴ curves and adding an x⁷ and x¹⁰ curve to see what happens. We are also going to increase this range now from 1 to 30.
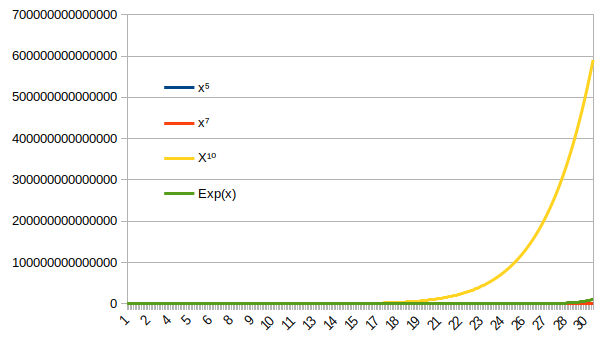
As you can see, the Exp (x) curve appears just above the red curve near the end of the range. However, the yellow x¹⁰ curve is well above Exp (x). Does this mean that the x¹⁰ curve is more terrible than the exponential?
Let’s advance this discussion, would it be x¹⁰⁰ more terrible than the exponential? Let’s just consider these two functions and an interval between 629 and 648.
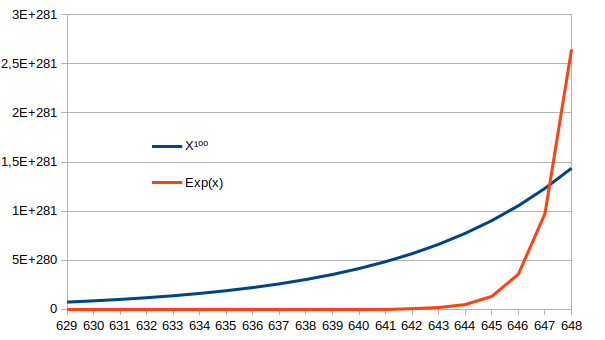
Look, the moment of overtaking, the exponential curve grew even more than an x¹⁰⁰ curve. The same goes for x¹⁰⁰⁰ or any fixed value to which x is raised.
That is why dealing with a threat whose power grows exponentially is so terrible.
The irony of this meme is that Saitama’s power is always greater than any opponent he faces, that is, for him if the enemy is increasing his power exponentially, everything is “Ok”, since the fight will end smoothly for you .
However, for any other creature, to see a threat with power growing exponentially and to think that everything is “Ok”, is not to understand how terrible this graph means for their lives.
I hope you enjoyed this explanation and that it may have helped you to reflect on the terror of facing threats represented by exponential curves.